
Product
BellaRates
Streamline electrification costs with our leading-edge rate management & insights engine for utilities & energy companies.
We'll handle your electric rates; you handle your energy business.

Meet Bellarates, the only tool you need for complex rates management.
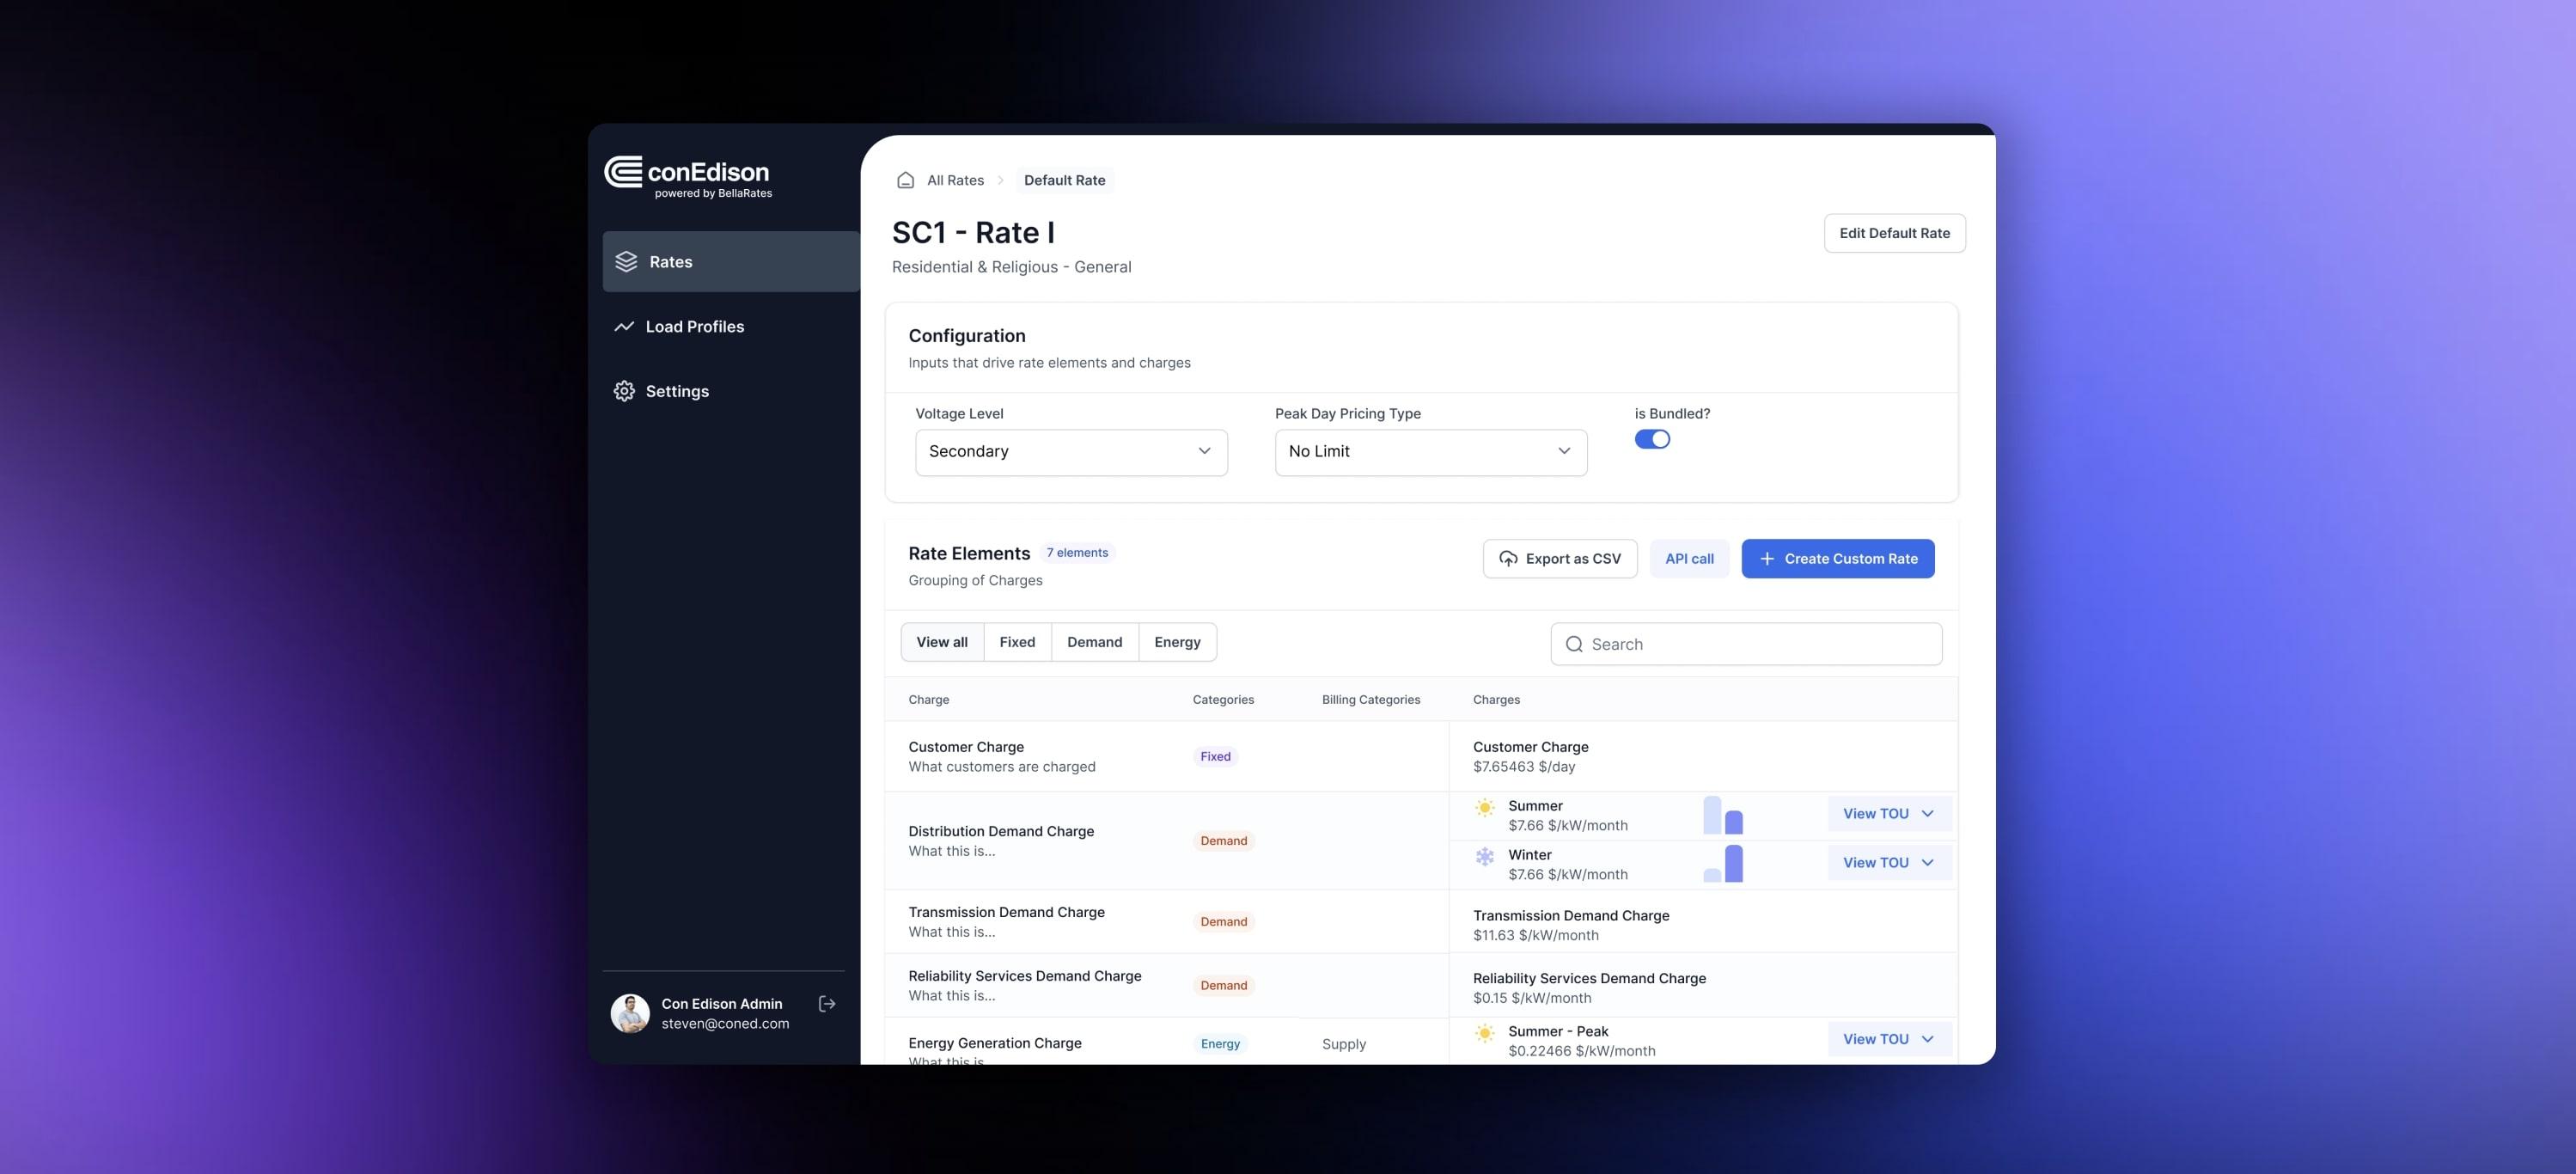
Make rate calculations less complex and more personalized for customers and sales prospects.
Our cutting-edge electrification rate management engine helps electric utilities and energy transition companies manage rates down to the customer level and then use them for analytics, proposals, and internal software tools by way of API.
Our tool empowers your teams to make informed decisions, optimize rate structures, and track changes with confidence. Align your operations with evolving energy markets while boosting confidence in rate-related financial impacts and customer satisfaction and understanding.

BellaRates
See how BellaRates can help you save
Request a product demo of Bellarates today and witness the impact of streamlined rate calculations on your operations. Our team is ready to walk you through each aspect of our platform, showing you how it can be tailored to meet your specific needs and challenges.
Go To BellaRates